Highlights
Financial Highlights
Five-Year Summary
Mitsubishi Electric Corporation and Subsidiaries
| Yen (millions) | ||||||
| U.S. GAAP | IFRS | |||||
| Years ended March 31 | 2018 | 2018 | 2019 | 2020 | 2021 | 2022 |
|---|---|---|---|---|---|---|
| Revenue | ¥4,431,198 | ¥4,444,424 | ¥4,519,921 | ¥4,462,509 | ¥4,191,433 | ¥4,476,758 |
| Operating profit | 318,637 | 327,444 | 290,477 | 259,661 | 230,195 | 252,051 |
| Profit before income taxes | 364,578 | 353,206 | 315,958 | 281,986 | 258,754 | 279,693 |
| Net profit attributable to Mitsubishi Electric Corp. stockholders |
271,880 | 255,755 | 226,648 | 221,834 | 193,132 | 203,482 |
| Total assets | 4,264,559 | 4,305,580 | 4,356,211 | 4,409,771 | 4,797,921 | 5,107,973 |
| Cash and cash equivalents | 599,199 | 599,199 | 514,224 | 537,559 | 767,406 | 727,179 |
| Bonds and borrowings | 311,485 | 311,950 | 298,438 | 267,008 | 248,897 | 217,171 |
| Mitsubishi Electric Corp. stockholders' equity | 2,259,355 | 2,294,174 | 2,399,946 | 2,429,743 | 2,754,293 | 2,975,941 |
| Cash flows from operating activities | 240,450 | 265,768 | 239,817 | 395,834 | 542,119 | 282,371 |
| Cash flows from investing activities | (178,219) | (182,015) | (210,668) | (203,997) | (176,552) | (114,867) |
| Free cash flows | 62,231 | 83,753 | 29,149 | 191,837 | 365,567 | 167,504 |
| Cash flows from financing activities | (128,291) | (149,813) | (112,067) | (156,454) | (157,352) | (241,319) |
| Per Share Amounts: Earnings per share attributable to Mitsubishi Electric Corp. stockholders (Yen) |
||||||
| Basic | ¥126.70 | ¥119.19 | ¥105.65 | ¥103.41 | ¥90.03 | ¥95.41 |
| Diluted | - | 119.19 | 105.65 | 103.41 | 90.03 | 95.41 |
| Cash dividends declared (Yen) | 40 | 40 | 40 | 40 | 36 | 40 |
| Mitsubishi Electric Corp. stockholders' equity (Yen) | ¥1,052.96 | ¥1,069.19 | ¥1,118.83 | ¥1,132.69 | ¥1,283.88 | ¥1,409.08 |
| Financial Ratios | ||||||
| Operating profit ratio (%) | 7.2 | 7.4 | 6.4 | 5.8 | 5.5 | 5.6 |
| Return on revenue (%) | 6.1 | 5.8 | 5.0 | 5.0 | 4.6 | 4.5 |
| Return on equity (ROE) (%) | 12.6 | 11.7 | 9.7 | 9.2 | 7.5 | 7.1 |
| Return on assets (ROA) (%) | 6.4 | 6.0 | 5.2 | 5.1 | 4.2 | 4.1 |
| Mitsubishi Electric Corp. stockholders' equity ratio (%) |
53.0 | 53.3 | 55.1 | 55.1 | 57.4 | 58.3 |
| Bonds and borrowings to total assets (%) | 7.3 | 7.2 | 6.9 | 6.1 | 5.2 | 4.3 |
NOTES:
- The consolidated financial statements of the Group are prepared in accordance with International Financial Reporting Standards (IFRS) from the year ended March 31, 2019 and also for the fiscal year ended March 31, 2018 as comparative information.
- The balance of bonds and borrowings and the ratio of bonds and borrowings to total assets include lease liabilities until the fiscal year ended March 31, 2019.
- Diluted earnings per share attributable to Mitsubishi Electric Corp. stockholders is equal to Basic earnings per share attributable to Mitsubishi Electric Corp. stockholders under IFRS, as no dilutive securities existed.
Overview
(Year ended March 31, 2022)
The economy in the fiscal year ended March 31, 2022 generally continued to see recovery in the corporate sector in the U.S., Europe and Japan. The household sector continued to recover in the U.S. and Europe, while in Japan there was the downward pressure stemming from the novel coronavirus diseases (COVID-19), despite recovery owing to normalization of economic activities. China continued to see recovery in export and manufacturing, while the pace of recovery in the household sector slowed down. There was also the impact of the rise in material prices and logistics costs as well as a prolonged components shortage.
In this environment, the Mitsubishi Electric Group has been working even harder than before to uplift profitability by strengthening its business portfolio strategy towards sustainable growth, while continuously implementing initiatives to strengthen its competitiveness and business structure.
As a result, the business performance for the fiscal year ended March 31, 2022 is as follows.


Financial Position
(Year ended March 31, 2022)
Total assets as of the end of this fiscal year increased compared to the end of the previous fiscal year by 310.0 billion yen to 5,107.9 billion yen. The change in balance of total assets was mainly attributable to increases in inventories by 215.8 billion yen and other non-current assets by 100.4 billion yen.
Inventories increased due primarily to recovery in demand for Industrial Automation Systems and Home Appliances segments as well as the impact of semiconductor and electronic components shortages. Other non-current assets increased due mainly to an increase in net defined benefit assets mainly reflecting a rise in stock prices.
Total liabilities increased compared to the end of the previous fiscal year by 83.2 billion yen to 2,010.5 billion yen due primarily to increases in trade payables by 59.8 billion yen and accrued expenses by 24.2 billion yen. Bonds and borrowings decreased compared to the end of the previous fiscal year by 31.7 billion yen to 217.1 billion yen, with the ratio of bonds and borrowings to total assets recording 4.3%, representing a 0.9 point decrease compared to the end of the previous fiscal year.
Mitsubishi Electric Corporation stockholders’ equity increased by 221.6 billion yen compared to the end of the previous fiscal year to 2,975.9 billion yen. The stockholders’ equity ratio was recorded at 58.3%, representing a 0.9 point increase compared to the end of the previous fiscal year. These changes mainly result from increases due to recording a net profit attributable to Mitsubishi Electric Corporation stockholders of 203.4 billion yen and accumulated other comprehensive income by 72.7 billion yen mainly reflecting the yen depreciating against other currencies, despite a decrease due to a dividend payment of 85.7 billion yen.


Cash Flows
(Year ended March 31, 2022)
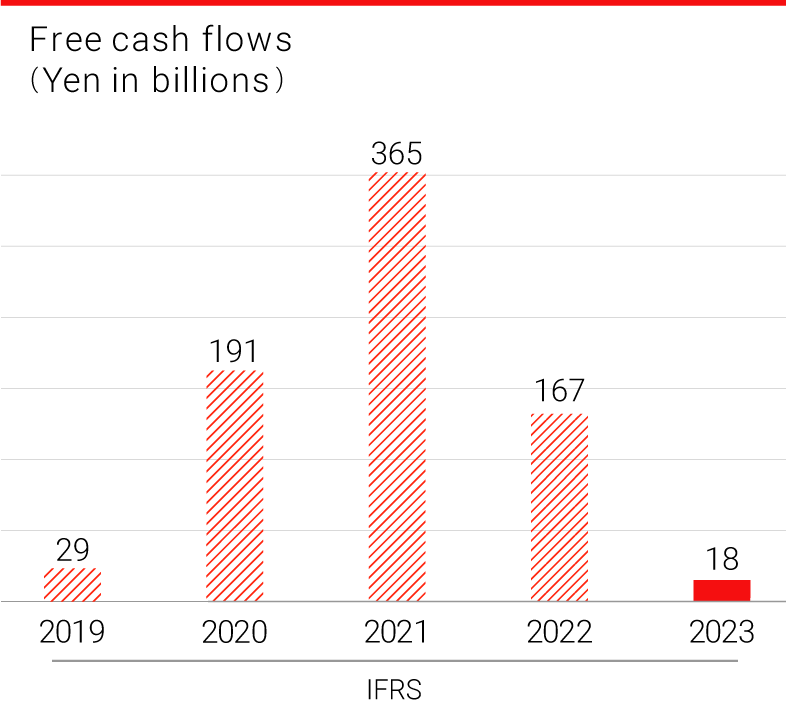
Cash flows from operating activities for fiscal 2022 was 282.3 billion yen (cash in), while cash flows from investing activities was 114.8 billion yen (cash out). As a result, free cash flow was 167.5 billion yen (cash in). Cash flows from financing activities was 241.3 billion yen (cash out), and cash and cash equivalents at end of period decreased from the end of the previous fiscal year by 40.2 billion yen to 727.1 billion yen.
Net cash provided by operating activities decreased by 259.7 billion yen from the previous fiscal year due primarily to an increase in inventories despite increased profit.
Net cash used in investing activities decreased by 61.6 billion yen from the previous fiscal year due mainly to an increase in proceeds from sale of investment securities and a decrease in purchase of property, plant and equipment in fiscal 2022 as a result of restricted capital expenditures in the previous fiscal year.
Net cash used in financing activities increased by 83.9 billion yen from the previous fiscal year due primarily to an increase in the purchase of treasury stock and a decrease in proceeds of short-term borrowings.